Earth Observation (EO) Lab
Department of Geography | Humboldt-Universität zu Berlin
We advance terrestrial Earth Observation from space to better understand global change in land systems.
Video: European Space Agency-ESA, extracted from video "Earth from space - sentinel-2 exceeds expectations" (minute 2:36-2:40)
EARSeL Workshop on Imaging Spectroscopy 2026
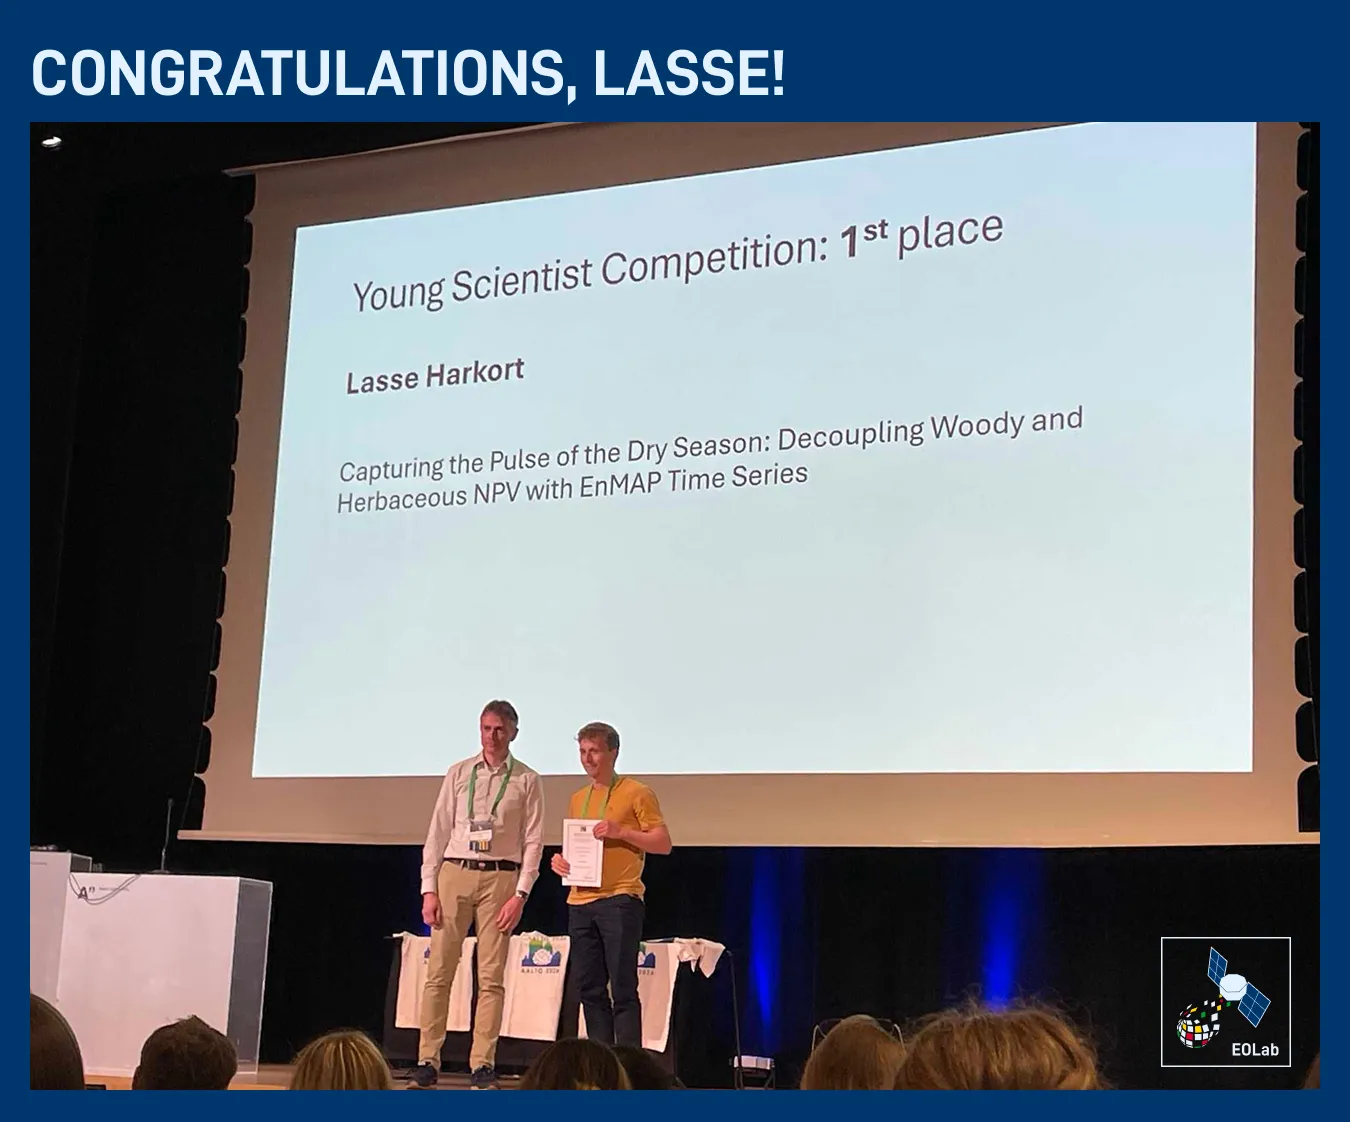
The EOLab participated in the 14th EARSeL Workshop on Imaging Spectroscopy, hosted by Aalto University in Helsinki, Finnland. Lasse Harkort and Shawn Schneidereit presented their recent research utilizing EnMAP hyperspectral time series, and Andreas and Benjamin showed the newest EnMAP-Box features in a tutorial.
Special congrats to Lasse Harkort, who won the Young Scientist Award with his presentation “Capturing the Pulse of the Dry Season”, showing how EnMAP time series can disentangle different NPV types.
Lange Nacht der Wissenschaften 2026
Am 6. Juni 2026 findet wieder die Lange Nacht der Wissenschaften statt, zu der auch das Geographische Institut seine Türen für Interessierte öffnen wird.
Das Earth Observation Lab (EOLab) wird sich im 1. Stock des Foyers vorstellen. Wir geben für Jung und Alt spannende Einblicke, wie Satellitendaten entstehen und was wir darin alles erkennen können.
Girls Day 2026
Das EOLab lädt ein zum Girls’Day am 23. April 2026. An diesem Tag können Schülerinnen vor Ort erfahren, wie wir Methoden der Fernerkundung nutzen um unsere Umwelt besser zu verstehen.
Du bist interessiert? Weitere Infos zum Girls’Day und zur Anmeldung findest du auf www.girls-day.de.
[english]
The Girl’s Day 2026 will take place on April 23. The EOLab invites interested schoolgirls to come and experience how we can use remote sensing to study and better understand our environment.
Are you interested? Then find more infomation and how to sign up on the Girl’s Days Website
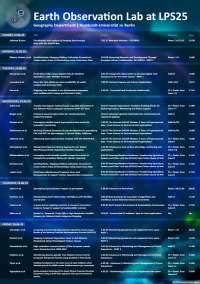
Living Planet Symposium 2025
We’re excited to announce that the Earth Observation Lab (EOLab) is participating the Living Planet Symposium 2025 (LPS25), taking place in Vienna, Austria from 22.-26. June. Our team is presenting a wide range of work and innovative research.
Stay tuned for more updates on @humboldteolab.bsky.social